You all know I like maps and this one is no different.
Carl Størmer happened upon a European-country-to-US-State comparison based on GDP:
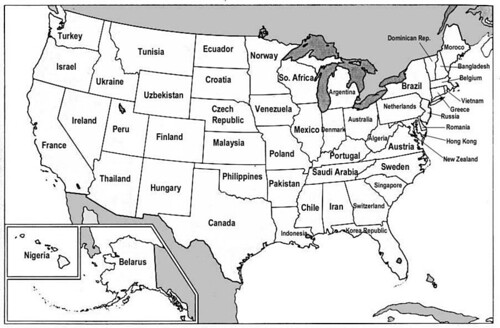
When seeing Norway's GDP in the context of this map, one realizes why Norway often is one of the last countries U.S. companies consider when expanding to Europe.
That's because it is equivalent to our Minnesota.
Regardless, the numbers are questionable. Someone took the time to re-order the list according to 2005 GSP data from the BEA and 2005 GDP data from the IMF (in $US billions). Because this doesn't consider purchasing power parity or black market economies, etc, it's still a bit of a stab in the dark:
United States 12455.83Japan 4567.44
Germany 2791.74
China 2234.13
United Kingdom 2229.47
France 2126.72
Italy 1765.54
California 1621.84Canada 1132.44
Spain 1126.57
Texas 982.40New York 963.47Brazil 795.67
Korea 787.57
India 771.95
Mexico 768.44
Russia 763.29
Australia 708.52
Florida 674.05Netherlands 629.91
Illinois 560.24
Pennsylvania 487.17
Ohio 442.44
New Jersey 430.79
Michigan 377.90Belgium 3 71.70
Switzerland 367.57
Georgia 364.31Turkey 362.46
Sweden 358.81
Virginia 352.75Taiwan 346.18
North Carolina 344.64
Massachusetts 328.54Saudi Arabia 309.95
Austria 305.34
Poland 303.23
Norway 295.67
Indonesia 281.26
Washington 268.50Denmark 259.64
Maryland 244.90South Africa 239.42
Indiana 238.64
Minnesota 233.29
Tennessee 226.50Greece 225.59
Wisconsin 217.54
Missouri 216.07
Colorado 216.06
Arizona 215.76Ireland 200.77
Finland 196.05
Connecticut 194.47Iran 192.35
Portugal 183.62
Argentina 181.55
Hong Kong SAR 177.70
Thailand 173.13
Louisiana 166.31
Alabama 149.80
Oregon 145.35
Kentucky 140.36
South Carolina 139.77Venezuela 132.85
Malaysia 130.84
Israel 129.84
UAE 129.64
Czech Republic 124.31
Colombia 122.27
Oklahoma 120.55Singapore 116.78
Chile 115.31
Iowa 114.29Pakistan 110.97
Nevada 110.55Hungary 109.20
New Zealand 108.52
Kansas 105.45Algeria 102.03
Nigeria 99.15
Romania 98.57
Philippines 98.37
Utah 89.84Egypt 89.48
Arkansas 86.80Ukraine 82.88
Washington, DC 82.78
Mississippi 80.20Peru 79.39
Kuwait 74.60
Nebraska 70.26
New Mexico 69.32Bangladesh 60.81
Kazakhstan 56.09
New Hampshire 55.69
Delaware 54.35
West Virginia 53.78
Hawaii 53.71Morocco 51.62
Vietnam 51.39
Slovak Republic 47.46
Idaho 47.18
Maine 45.07
Rhode Island 43.79
Alaska 39.87Libya 38.74
Croatia 38.51
Luxembourg 36.53
Ecuador 36.49
Qatar 34.34
Slovenia 34.03
Angola 32.81
South Dakota 31.07Oman 30.73
Montana 29.85Belarus 29.57
Dominican Rep. 29.09
Tunisia 28.67
Sudan 27.54
Wyoming 27.42Guatemala 27.37
Syria 27.30
Bulgaria 26.72
Lithuania 25.50
North Dakota 24.18Serbia 24.06
Sri Lanka 23.53
Vermont 23.13Lebanon 22.05
Costa Rica 19.99
Kenya 18.73
 This work is licensed under a Creative Commons Attribution-NonCommercial-ShareAlike 2.5 License.
the guys: philogynist jaime tony - the gals:raymi raspil
This work is licensed under a Creative Commons Attribution-NonCommercial-ShareAlike 2.5 License.
the guys: philogynist jaime tony - the gals:raymi raspil